Dashboard
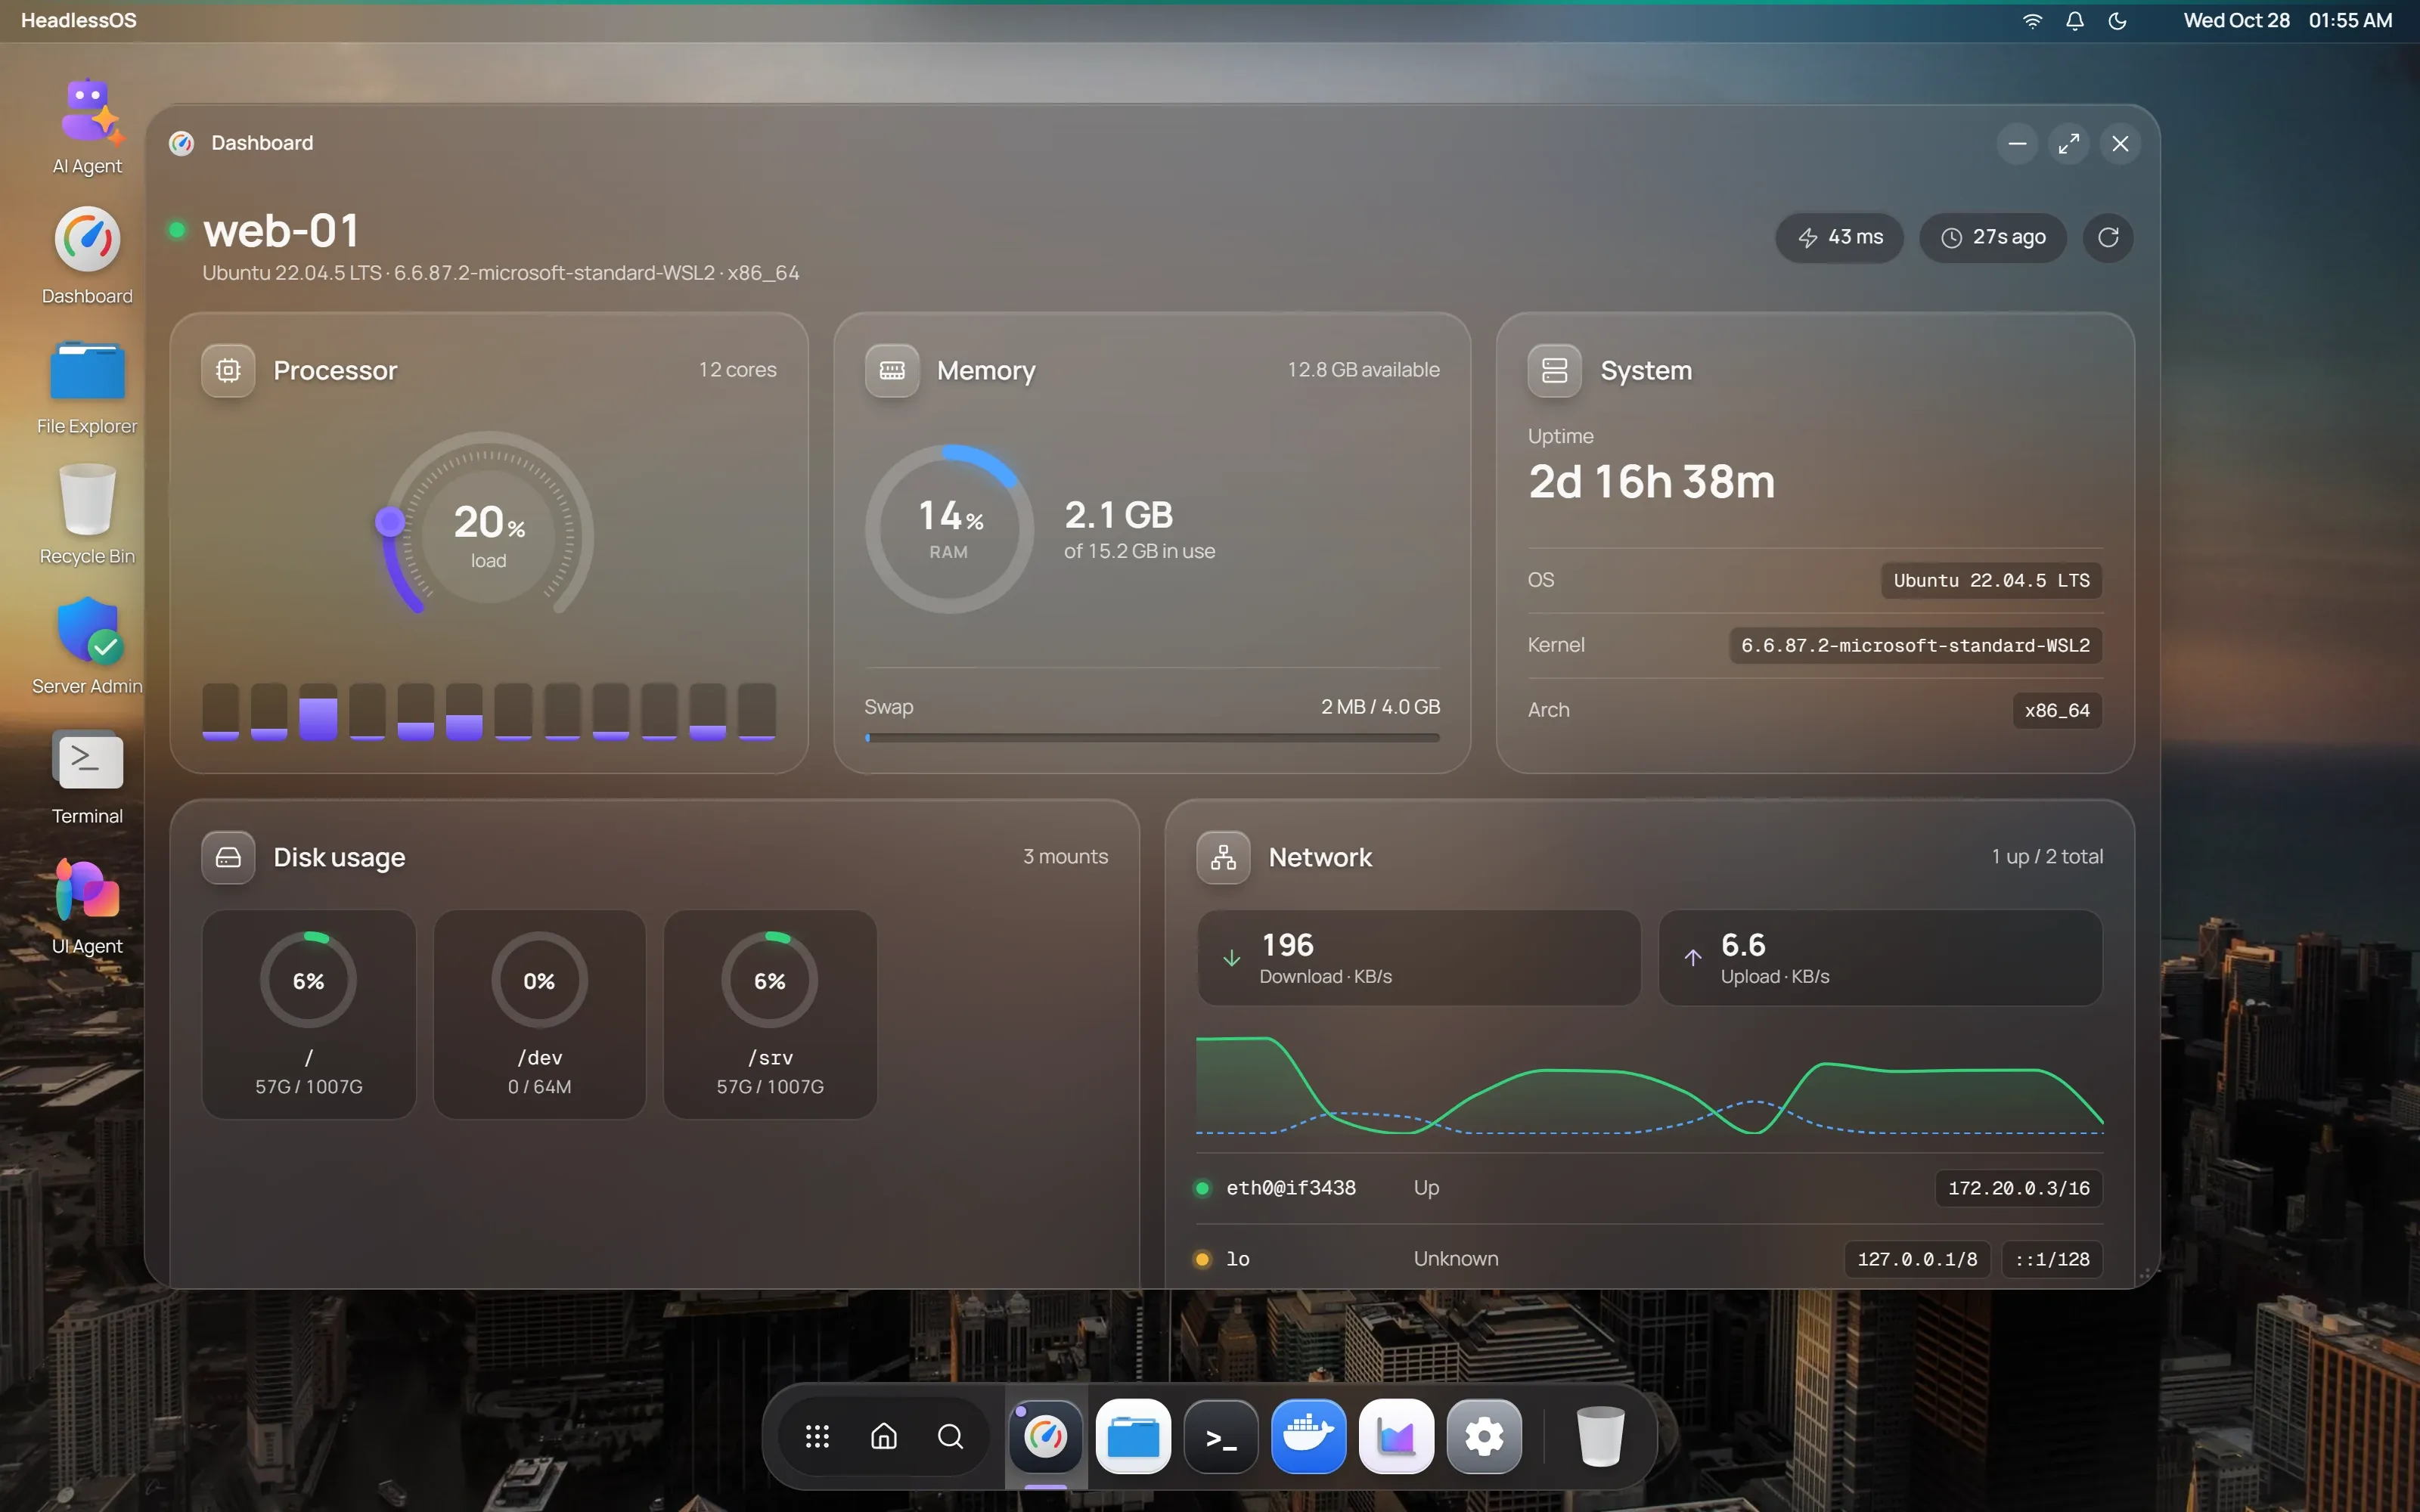
See CPU, memory, disk, network and uptime for a Linux server in the HeadlessOS Dashboard, with live load and traffic graphs read over SSH.
The Dashboard shows the health of one server in a single window. It needs no extra tools on the server. It reads standard commands such as df -h, free -m and ip -brief addr over SSH.
To open it, click Dashboard in the dock or double-click its desktop icon.
What the Dashboard shows
Section titled “What the Dashboard shows”The header shows the server’s hostname, operating system, kernel and architecture. Next to them are the latency of the last refresh, the time since that refresh, and a Refresh button.
| Card | What it shows |
|---|---|
| Processor | Overall load, the number of cores, and a tile for each core. Hover a tile to see that core’s load. |
| Memory | RAM in use, the amount available, and swap use. |
| System | Uptime, OS, kernel and architecture. |
| Disk usage | A ring for each mounted filesystem, with percent used, mount point, and used and total size. |
| Network | Download and upload rates, a graph of recent traffic, and each network interface with its state and addresses. |
A disk ring turns amber at 70% and red at 90%. The download and upload rates add up all interfaces.
How often the Dashboard refreshes
Section titled “How often the Dashboard refreshes”| Data | How often it refreshes |
|---|---|
| Processor and network rates | Every 2 seconds |
| Memory, disks and system details | Every 30 seconds by default |
To change the second interval, open Settings, go to General and set Auto-Refresh Interval. Choose Off to update those cards only when you click Refresh.
Updates stop while the window is minimized. They start again when you restore it.
If the connection drops
Section titled “If the connection drops”If the SSH connection is lost, the Dashboard says so and shows a Reconnect button.
Related apps
Section titled “Related apps”- To see which process is using the CPU or memory, open Task Manager.
- To compare all your servers, use the Fleet overview.